FootGraphics · football-overlay.ru
Big-league football broadcasts
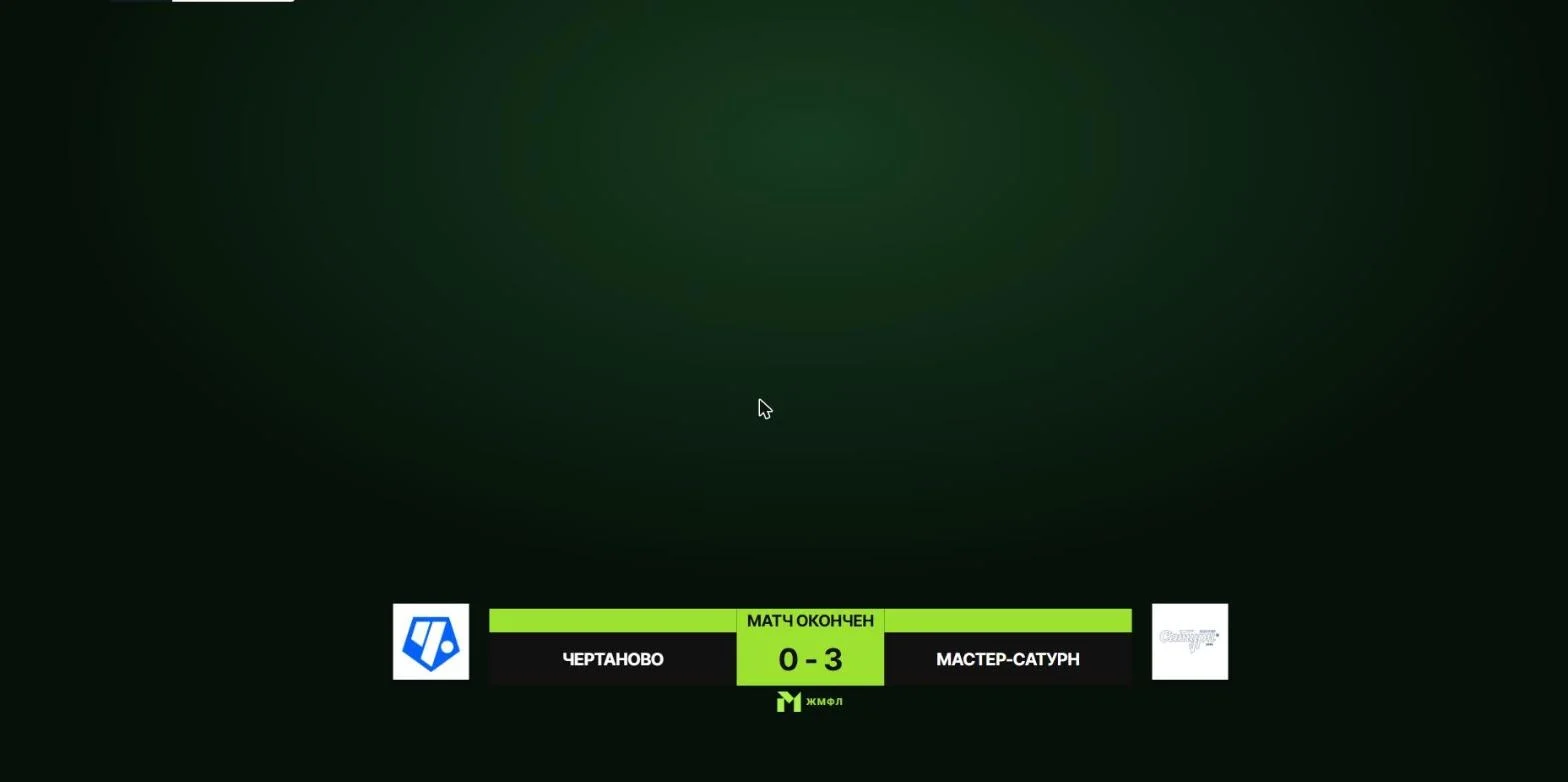
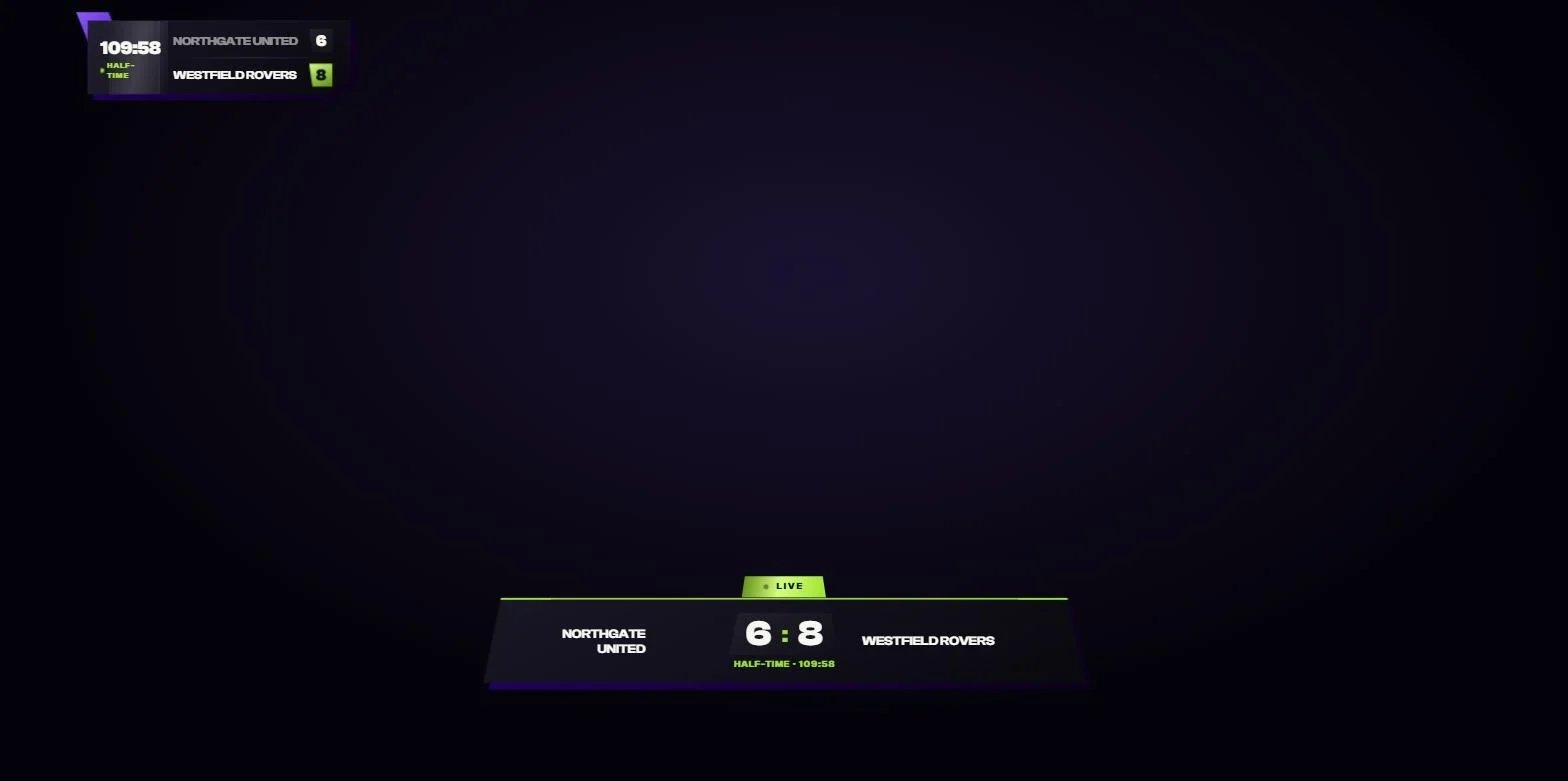
A live-graphics control system: operator console, 30+ graphics, match and league statistics — right in the browser.
Match control
Everything at hand, no window juggling
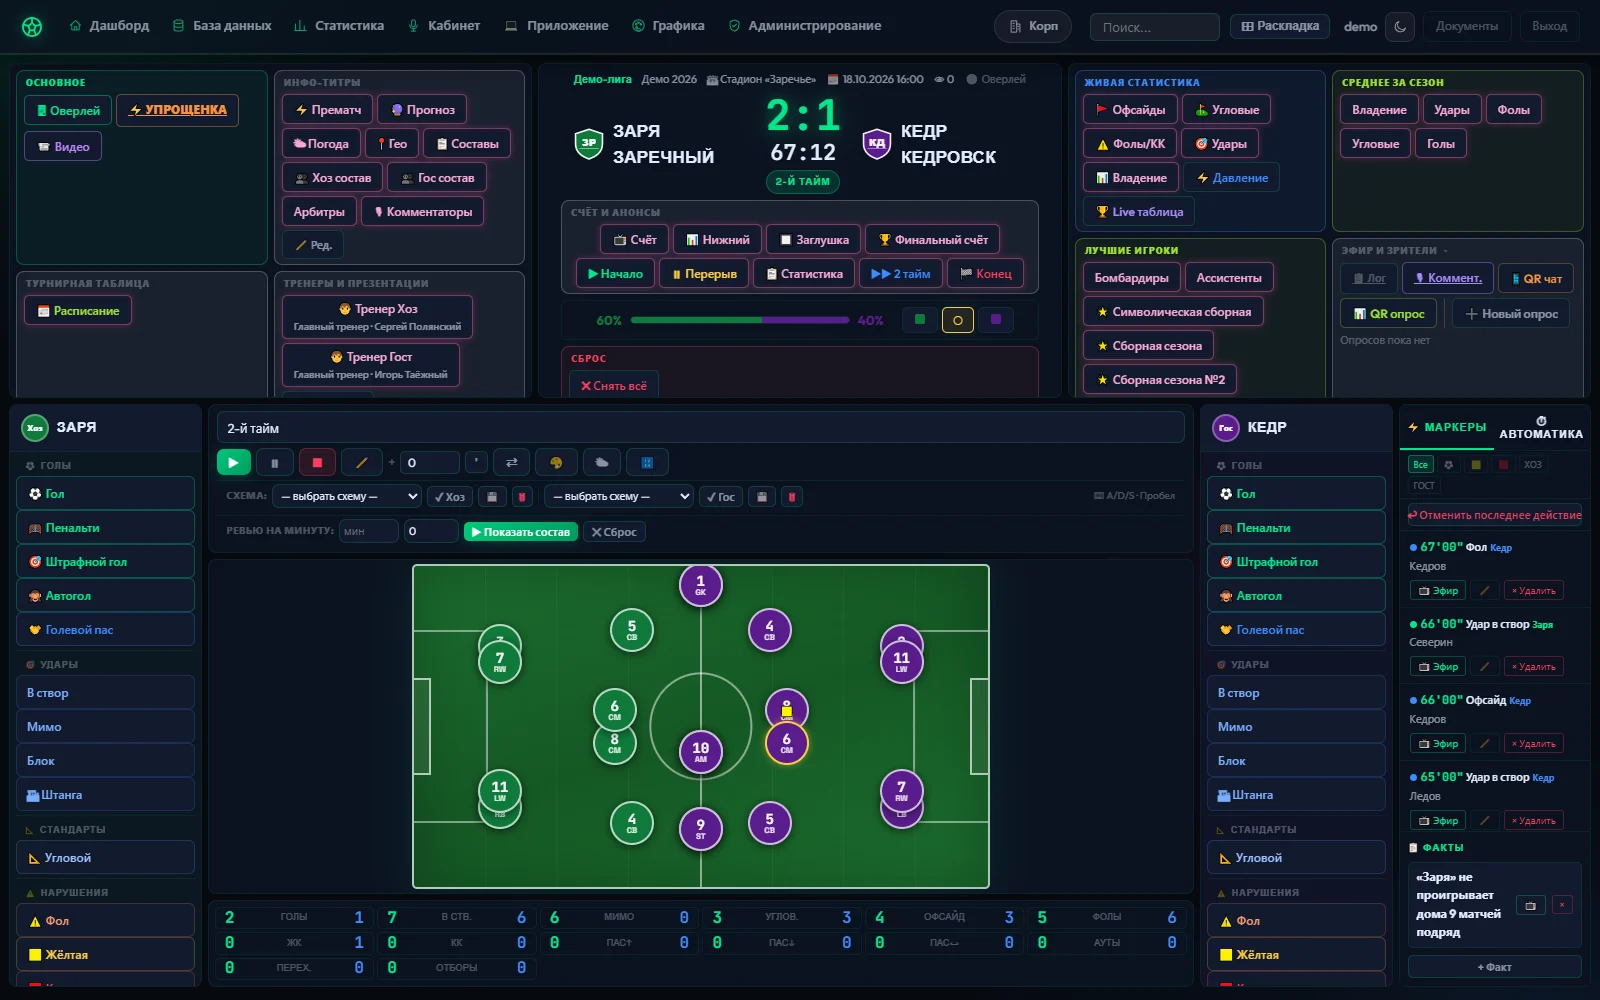
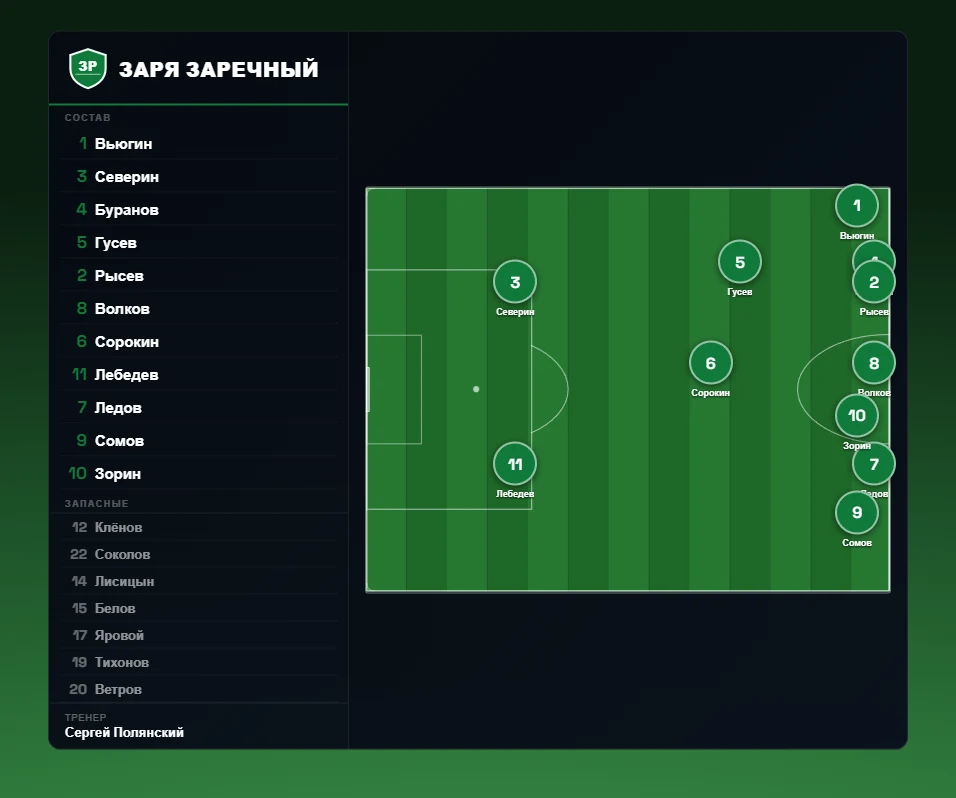
Scorebug and clock on top, the pitch with both formations in the centre, rosters and event buttons on the sides, graphics on the right. A goal changes the score instantly — scorer and details can follow.
- Clock with seconds, added time “45+3”
- Halves, half-time, extra time, shoot-out
- Possession: home / neutral / away
- Swap sides with mirrored positions
Match analysis
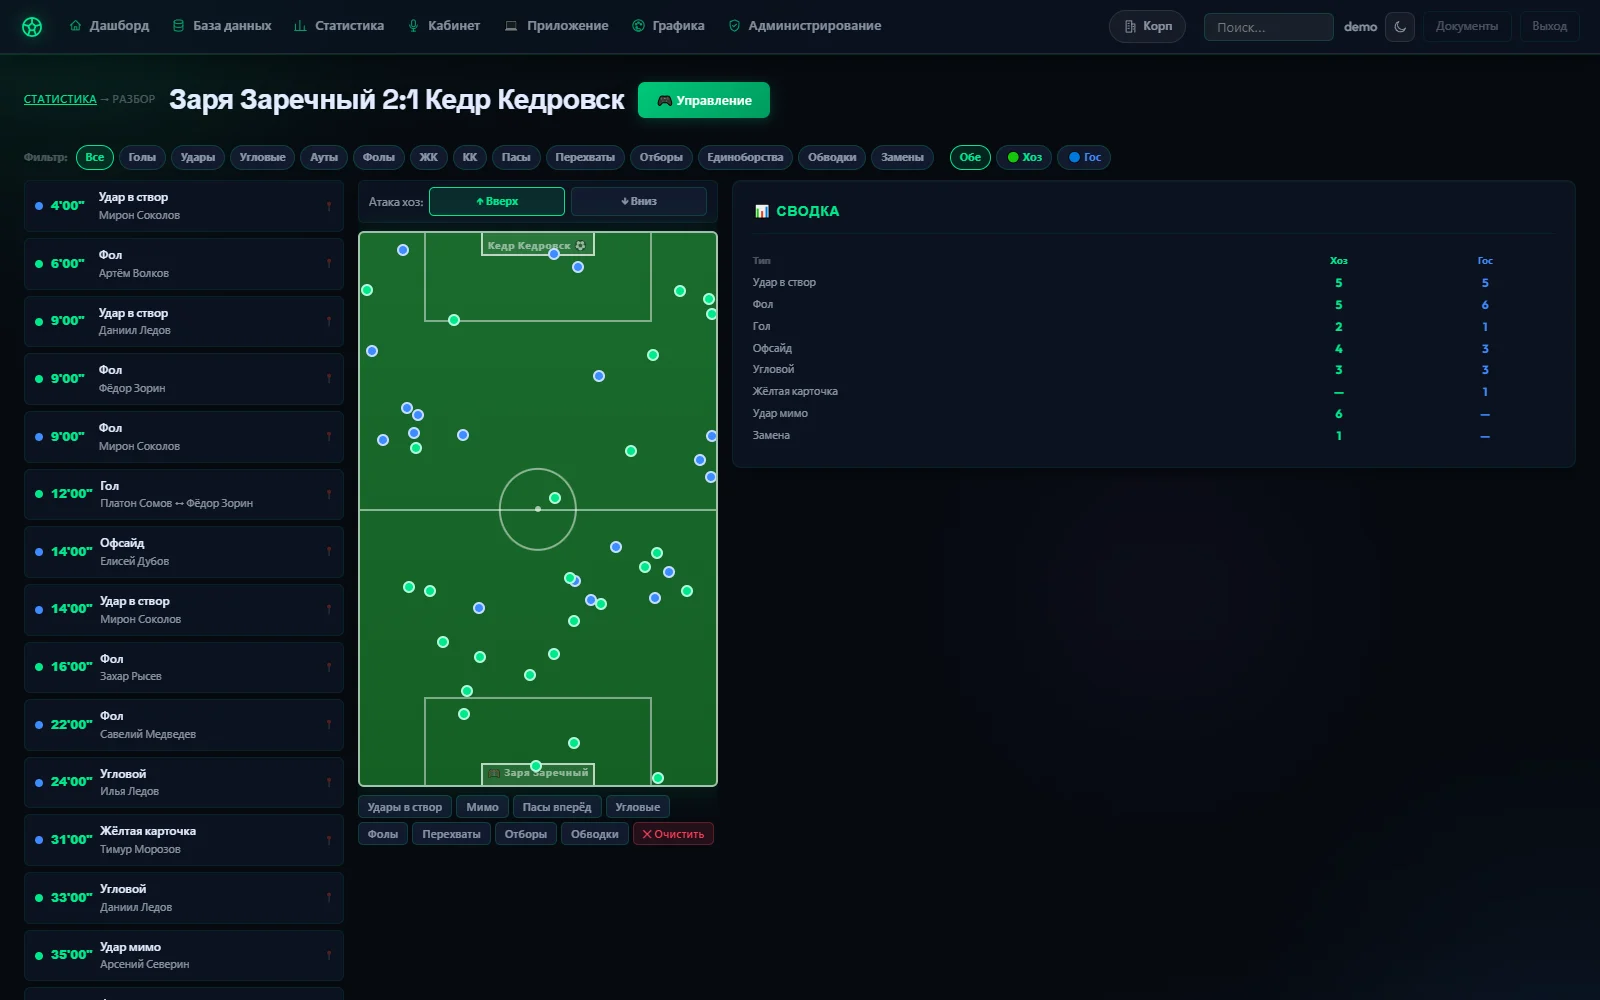
Every event on the pitch
After the game edit any event: time, player, second participant, card reason, spot on the pitch. Heat-map layers for shots, passes, interceptions — analysis for coaches.
Simple console
Big buttons for fast work
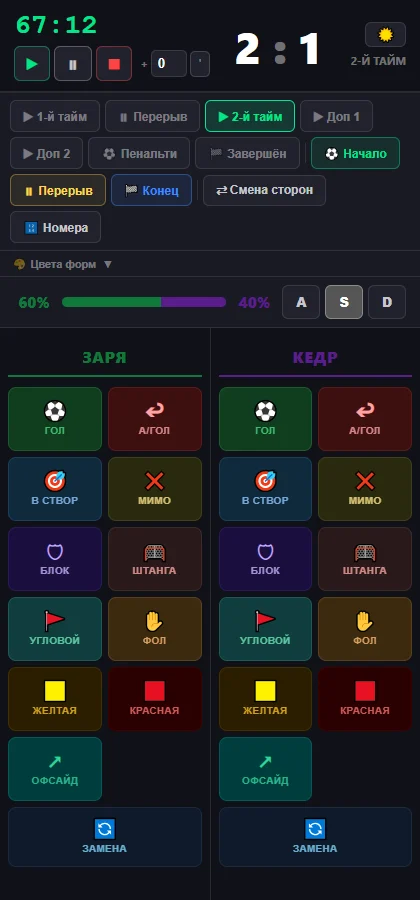
A separate mode with big buttons for goals, cards, shots and corners per team — run the match from a tablet or phone.
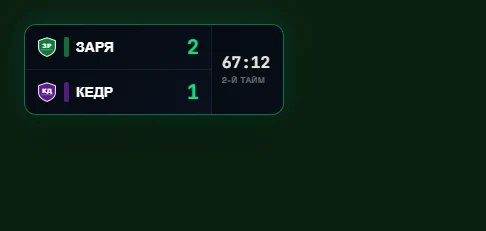
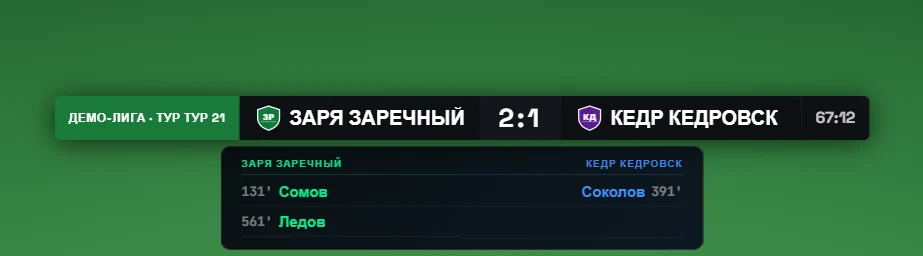
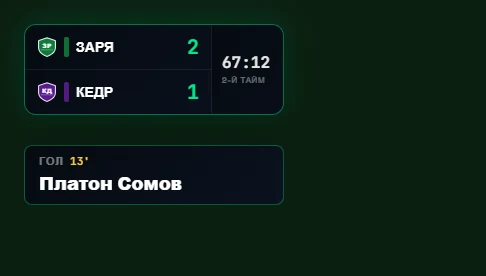
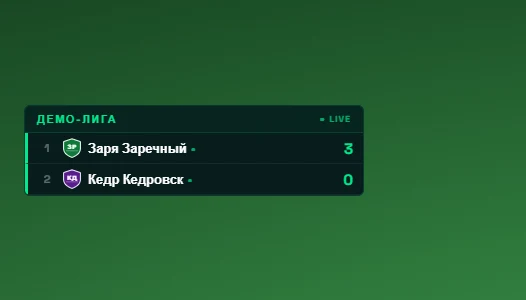
Score and events
The essentials, instantly on screen
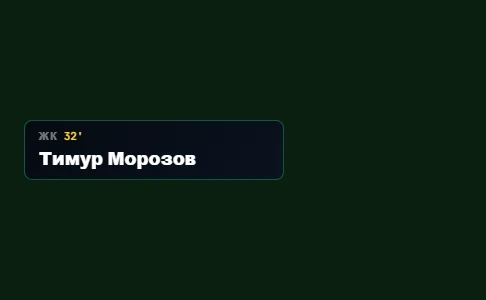
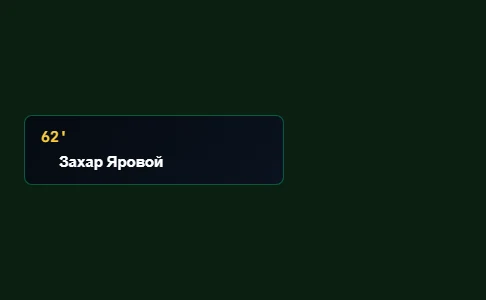
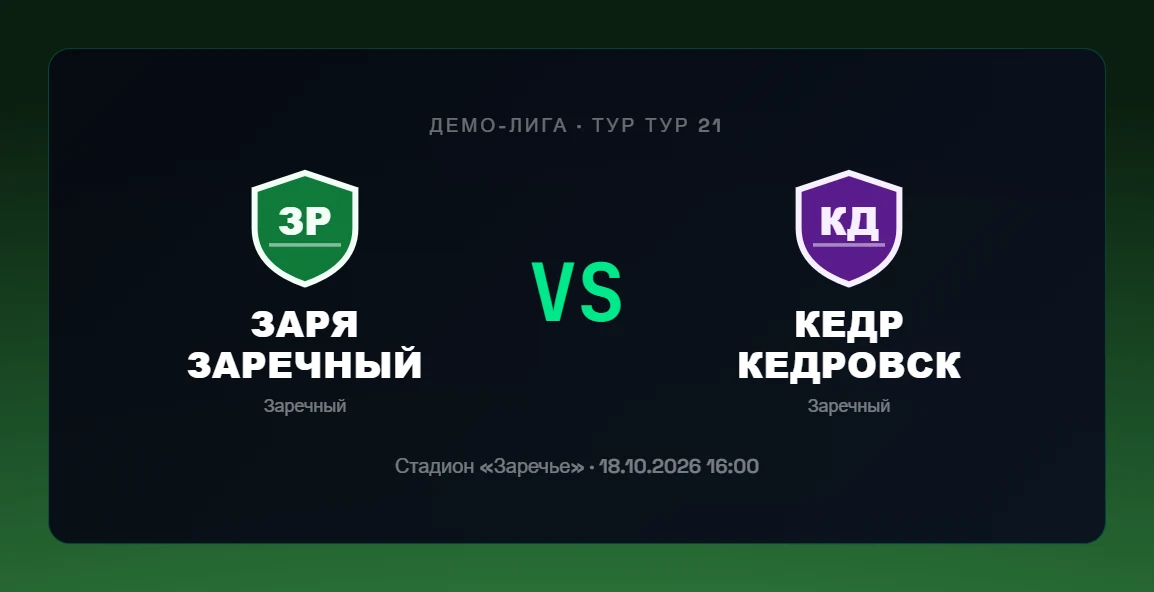
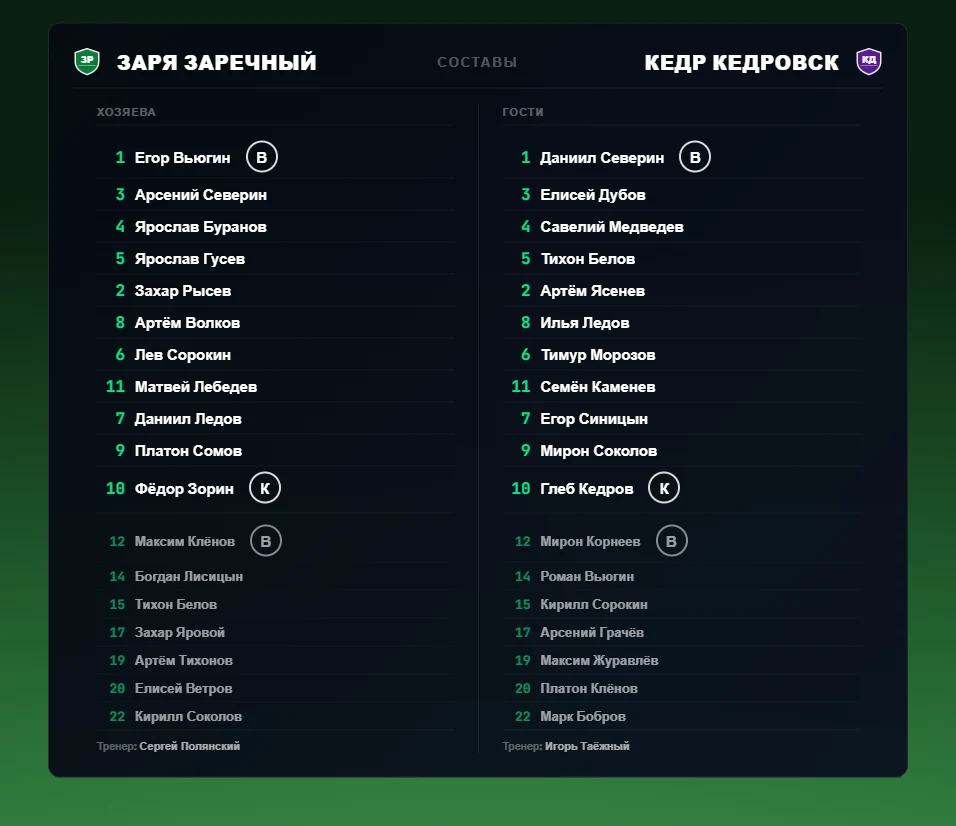
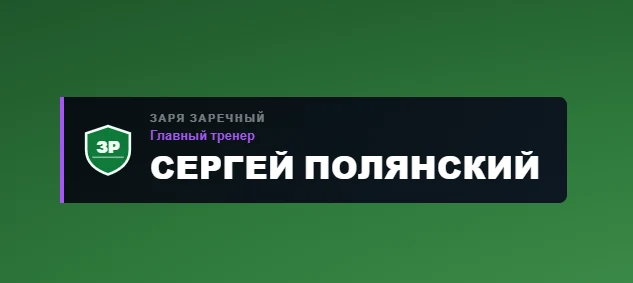
Line-ups
Teams before and during the game
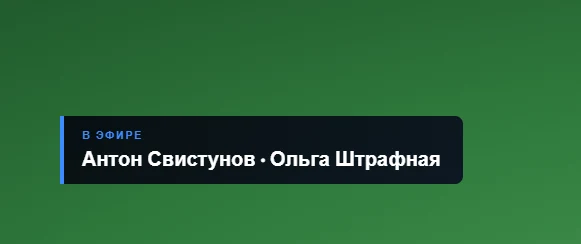
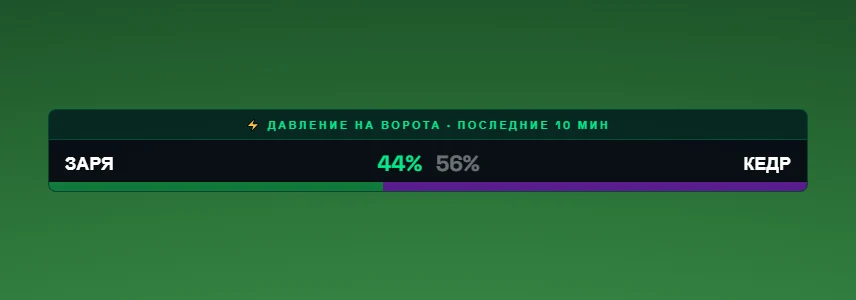
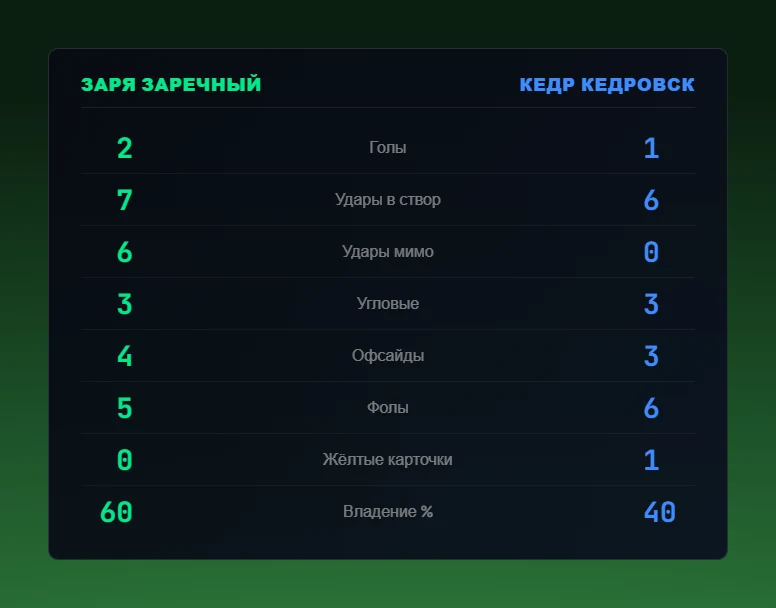
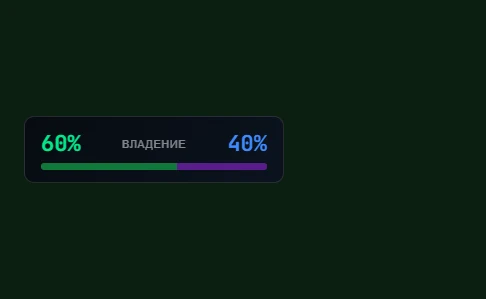
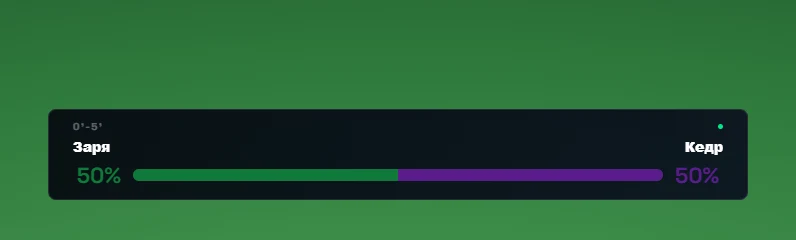
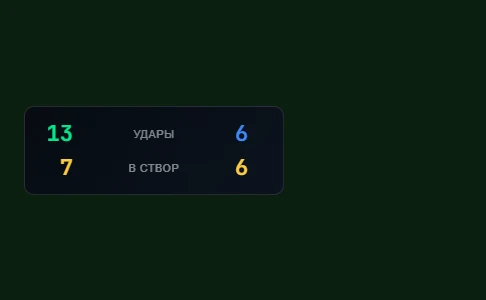
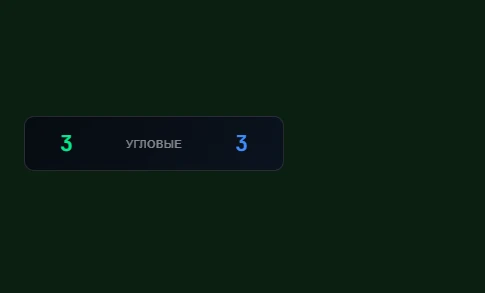
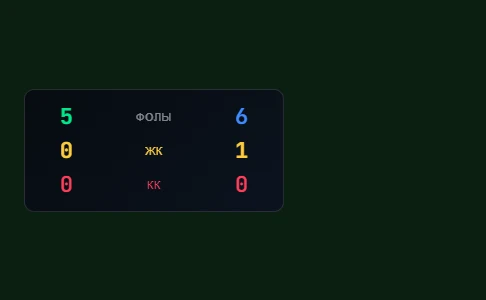
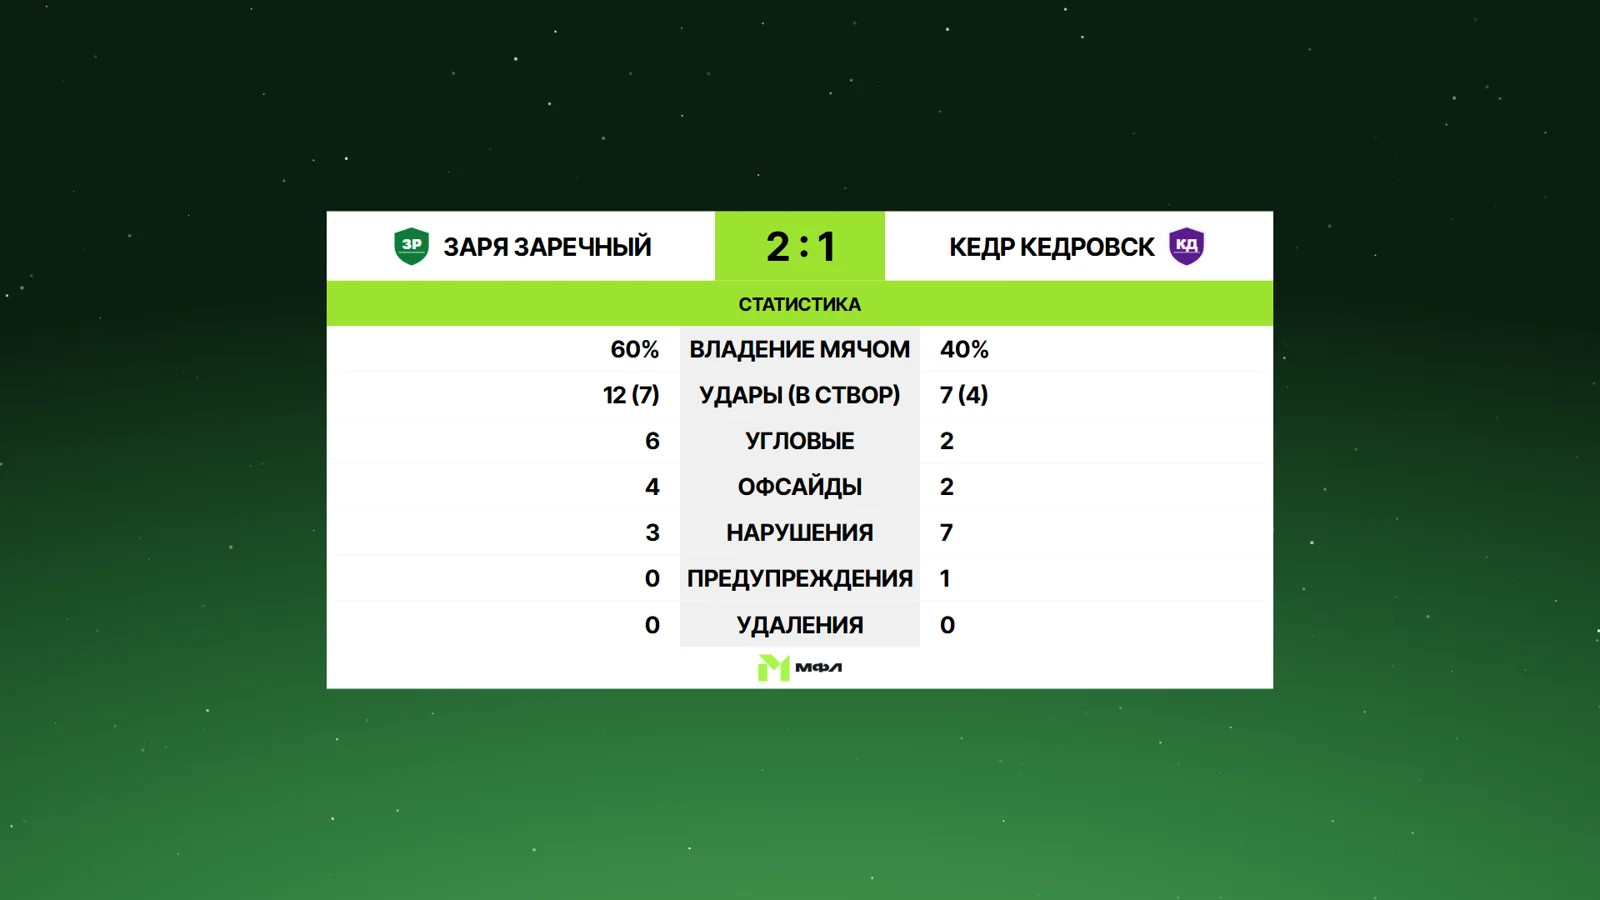
Stats on air
Numbers viewers want to see
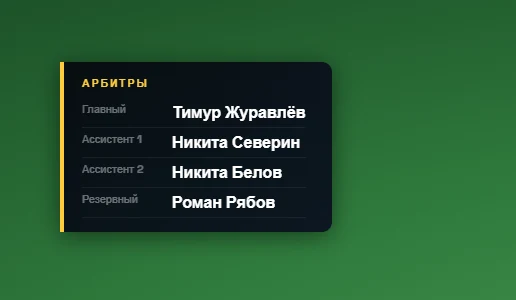
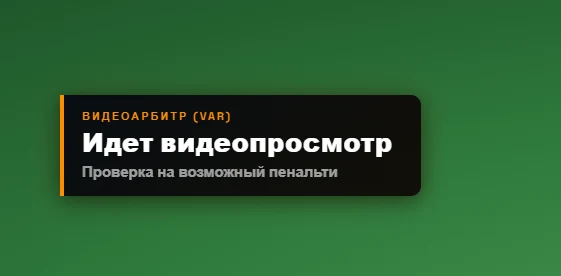
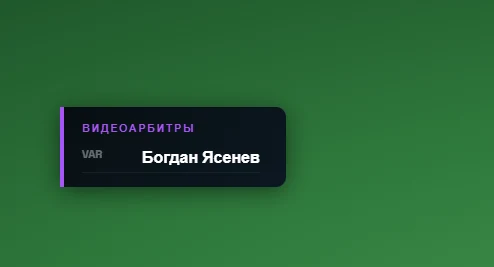
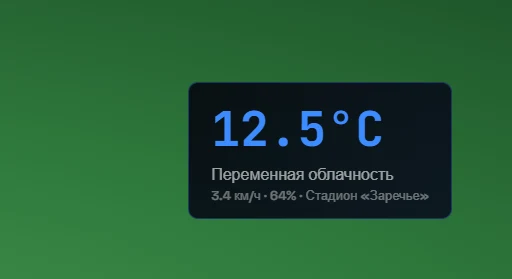
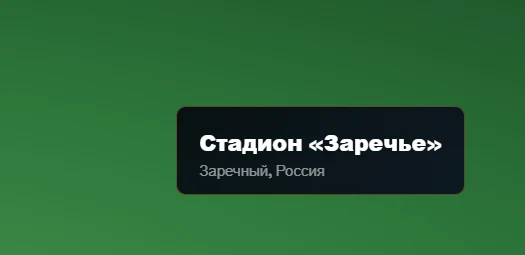
VAR and setting
Video review, weather, stadium

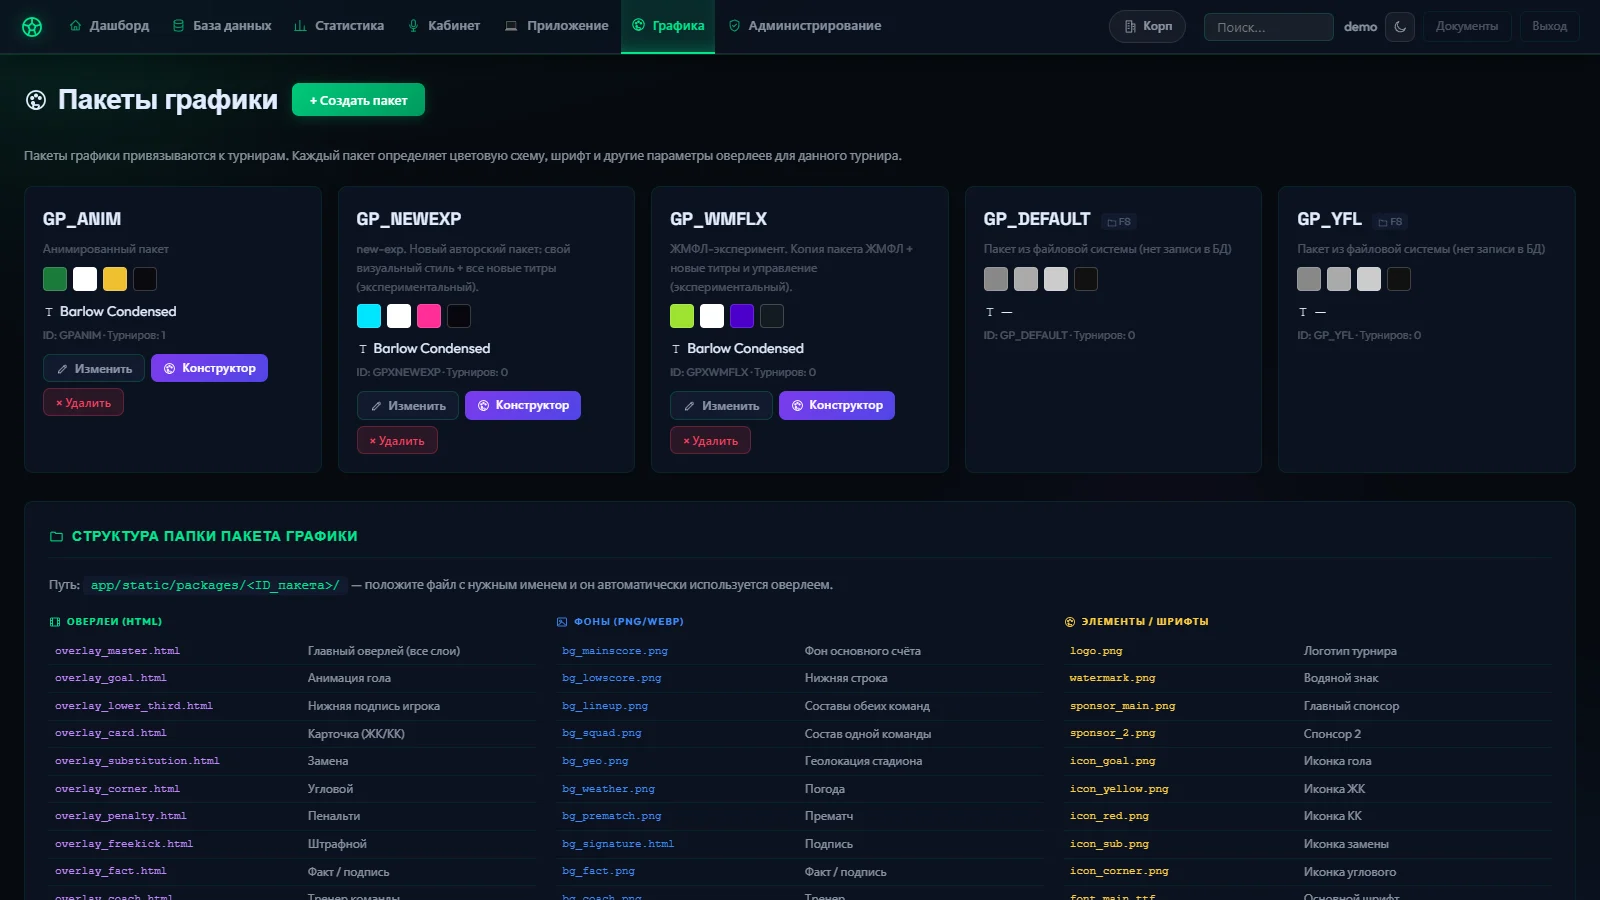
Graphics packages
One system — any brand
Colours, fonts, logo and the set of graphics live in a graphics package. Rebranding a league means picking another package. Graphics can be designed from scratch or imported from an existing brand book.
New packages
About 45 graphics in the experimental line
Team streaks, player milestones, skill radar, 3D formation, win probability, animated table, team travel route, hourly weather, minute of silence — plus a “Readiness” check before going live.
For commentators
Broadcast prep in five minutes
Form of both teams, head-to-heads, the table with both sides highlighted, player birthdays near match day, PDF reports for match, club, player and referee. Player comparison with a radar chart.
- Shared name-stress dictionary
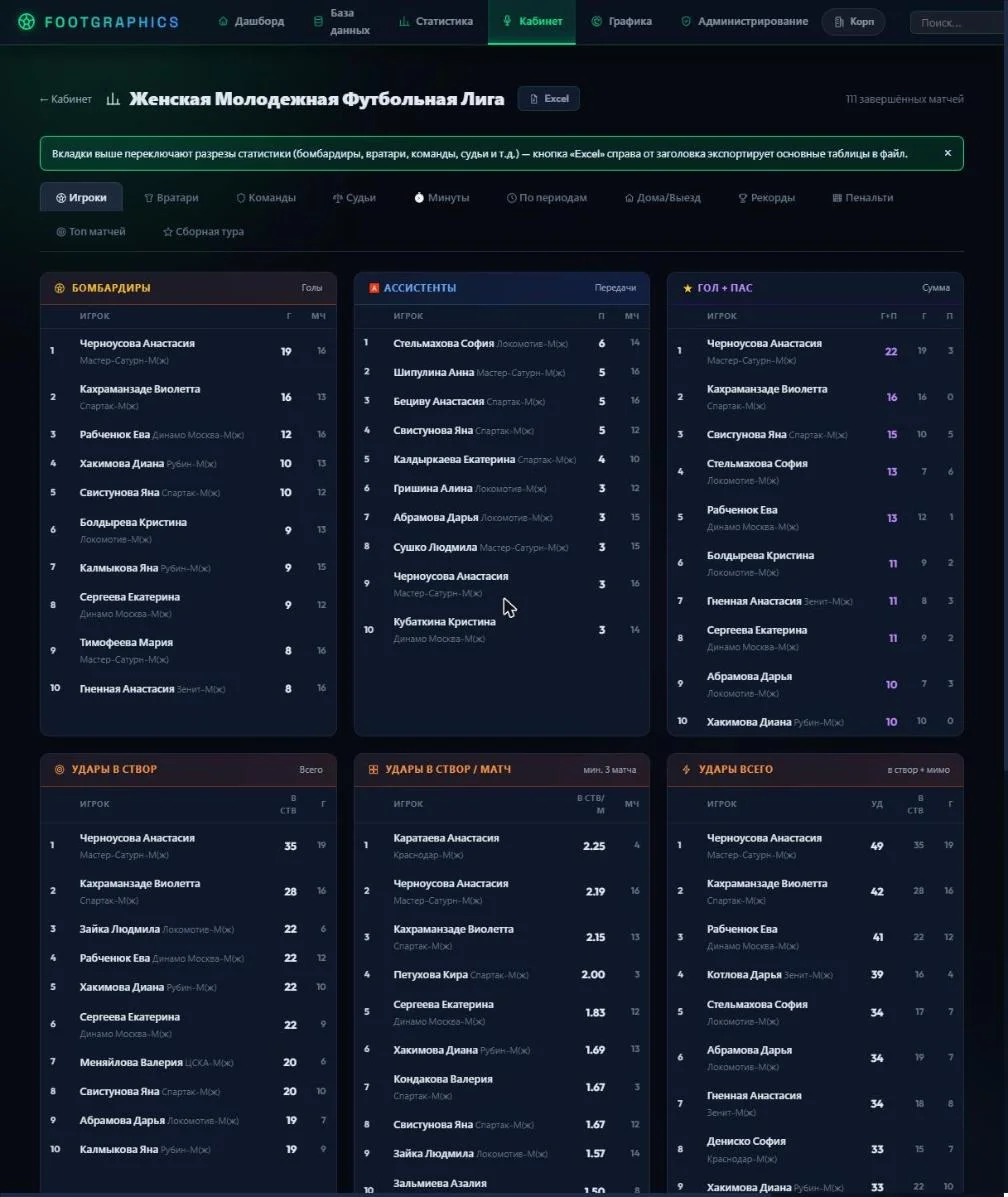
- League stats with Excel export
- Team of the week and of the season